AgData
CropData Gateway or AgData platform is an ecosystem for data aggregation, management and visualization, providing a seamless interface for third-parties to access and correspond with CropData's customers. It is powered by CropData's Geo-Spatial Tile Management (GSTM) system, a platform with hundreds of microservices, that manages primary and secondary data, based on location and time, generating over 200+ indices on 22-levels from a 10m x 10m spot in the farm upwards, using advanced data analytics.
Engines & Tools
Farmer Rating
Estimation of region-wise farmer credit risk to quantify the level of willful and non-willful default based on various socio-economic and production risk parameters. It also includes a farm, case and respective village rating.
Read MoreCommodity Balance Sheet
Commodity balance sheet shows the production, import, export and stock data of all the major agricultural commodities in a standardized form.
Read MoreIndices
GSTM powers various external and internal indices that provide data analytics across region and time. Learn More
Read MoreCrop Sowing and Harvesting Calendar
Crop Sowing and Harvesting Calendar is a comprehensive guide that provides timely information on planting, sowing and harvesting periods locally adopted in specific agro-climatic zones, with an easy to use visual tool.
Read MoreGeospatial Data Management
The GSTM system makes data available on a personalized basis to individual farmers, customized to their respective crop, location and vulnerability to different kinds of stress. It also provides CropData with the ability to generate customized alerts en masse. The GSTM system is powered by location and time-specific dynamic crop calendars which are further powered by advanced analytics, using machine learning algorithms, benchmark indices, weather correlations, impact models for yield and stress, across various zoom-levels.
Read MoreBenchmark Indexing & Proxying
CropData uses an automated workflow-based benchmarking across various regions (22 levels) and time for all data sets with an intelligent mechanism for proxying and data gap filling etc.
Read MoreGSTM Eye
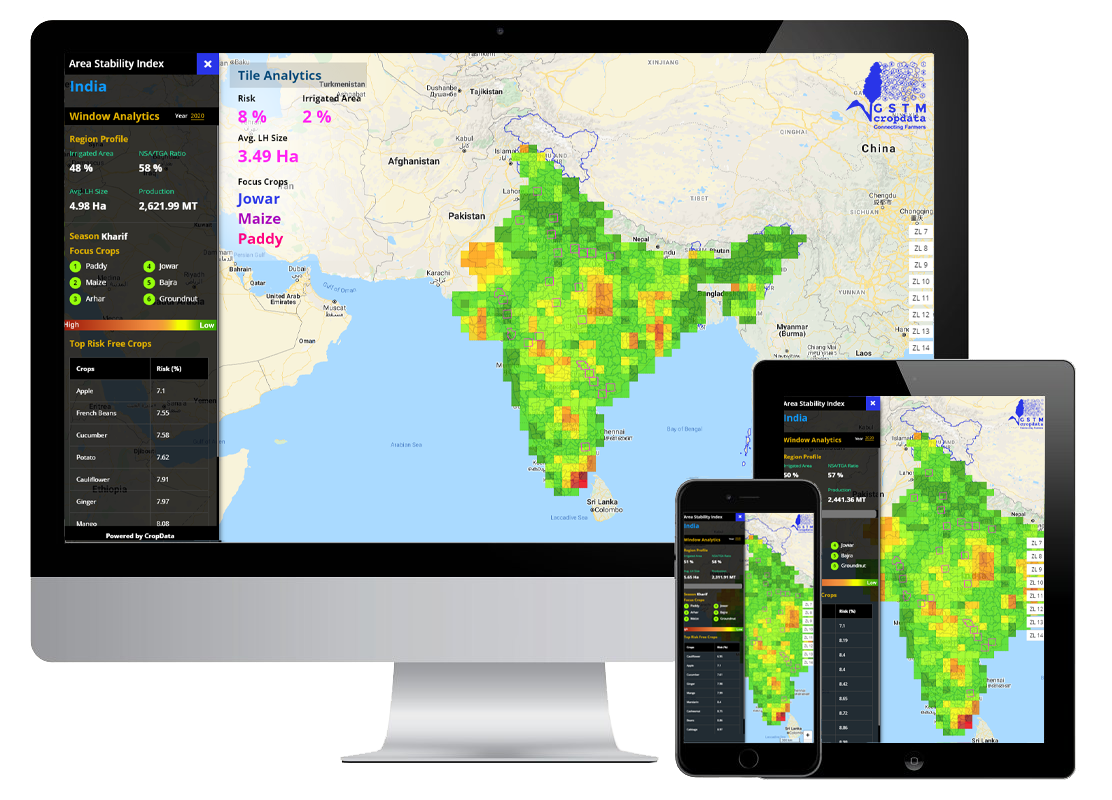
The various indices can be visualized on a dynamic map architecture, with the ability to have both high-level and granular view for quick decision making. GSTM and GSTM Eye can be interfaced with third-party data, and platforms on a seamless basis.
Read MoreCropData provides 200+ indices related to the agriculture sector in convenient formats including map-based visual interface through convenient APIs. Indices provide granular analytics with differential viewpoints across geographical areas/levels and time.
-
Multiple Cropping Index
Gross cropped area to total cultivable area, to estimate the extent of utilization of the farmland across seasons.
-
Cropping Intensity
Cropping intensity calculates the percentage of gross cropped area to the net sown area, to estimate the extent of cropping pattern across seasons.
-
Net Sown Index
The net sown index assesses the area in which total crops are grown once in a year, for a particular region.
-
Crop Farming Index
The crop farming index estimates the ratio of individual crop area to other crops in the region.
-
Sustainability Yield Index
Sustainability Yield Index estimates the stability of a crop by evaluating the trend in the crop yield over the years.
-
Area Diversity Index
Area Diversity index highlights the practice of growing different crops per unit area within a season (seasonal diversity) as well as within a year (rotational diversity).
-
Crop Irrigation Index
Irrigated area estimates the water availability of the crop-specific vegetated area in a particular region.
-
Farm-size Index
Farm-size index provides crop-specific average sizes of agricultural landholding.
-
Soil Fertility Index
The soil fertility index (SFI) is an indicator that is used to evaluate soil fertility in specific regions. We assess the overall soil quality by measuring changes in the physical, chemical, and biological indicators and transforming them into single metrics.
-
Agri Economy Index
The Agri economy index estimates crop-specific risk in the agriculture economy of the region.
-
Production Stability Index
The production index estimates the production risk in the area and yield of a particular commodity.
-
Area Stability Index
Area Stability Index (PYaR) estimates the risk of a region and helps to predict the uncertainty of that region.
-
Crop Stability Index
Crop Stability Index (IYaR) estimates crop-wise risk in a particular region.
-
Price Volatility Index
The price volatility index estimates crop-wise price fluctuation in a region.
-
MSP Realization Index
MSP realization index is the representation of the deviation of the spot price from the minimum support price (MSP) by crop and region.
-
Cost of Cultivation Index
Cost of Cultivation Index is the estimation of income of the farmer by crop and region.
-
Stress Occurrence Index
Stress occurrence Index provides the probability of the stress at any particular time by crop and region.
Geo-Spatial Tile Management (GSTM)
It's a proprietary data collection, analytics and visualization tool built on a geospatial and temporal architecture.
- It maintains internal and external data by location, geographic regions (levels), time, crop and stress.
- It can be customized to manage and visualize various indices where data is available by location and time.
- CropData has 17 indices available through the GSTM architecture, which can be integrated into third-party websites effortlessly through convenient APIs.